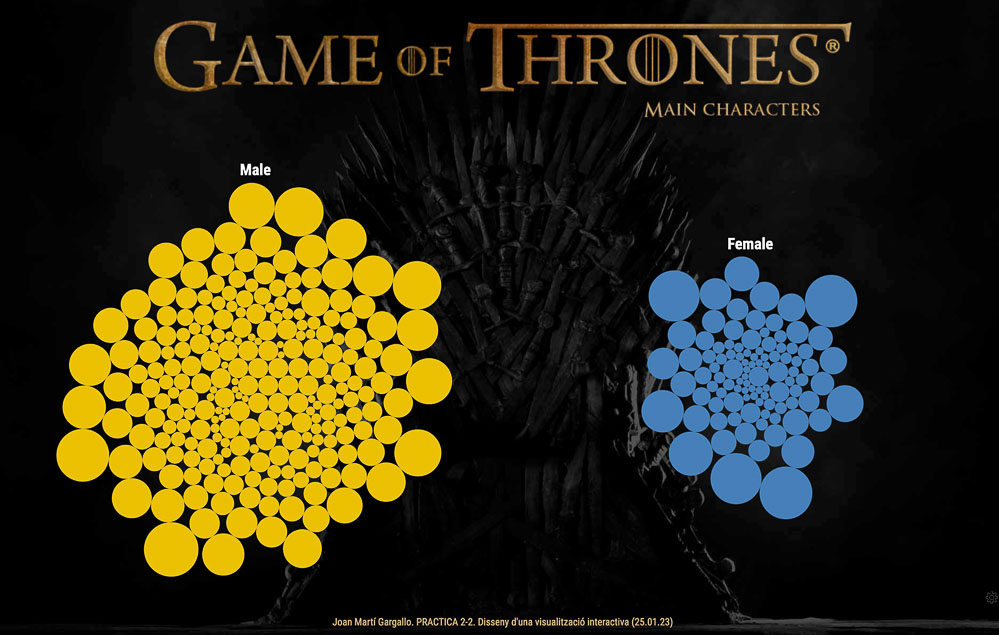
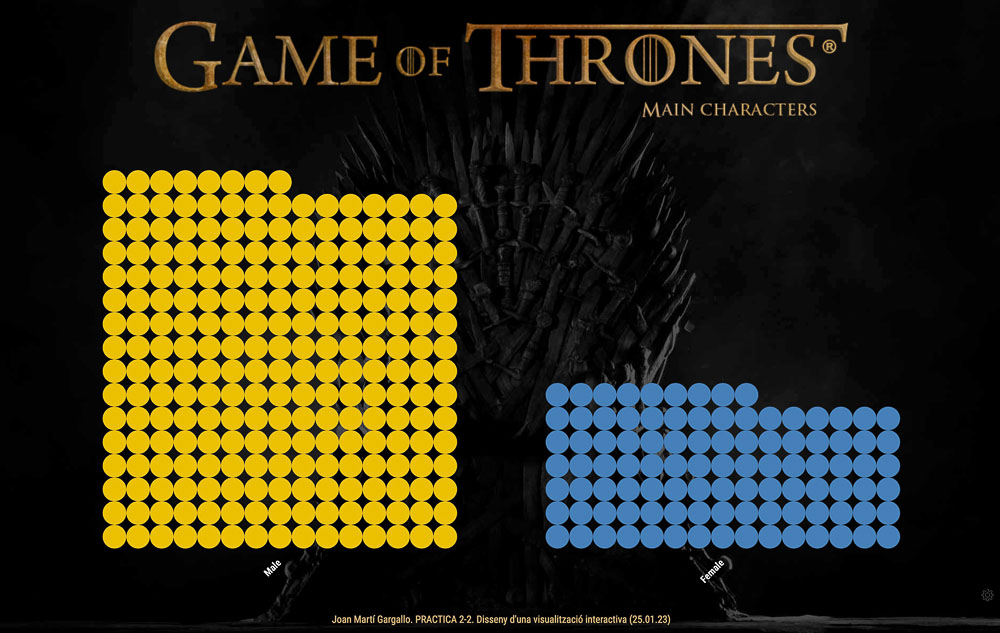
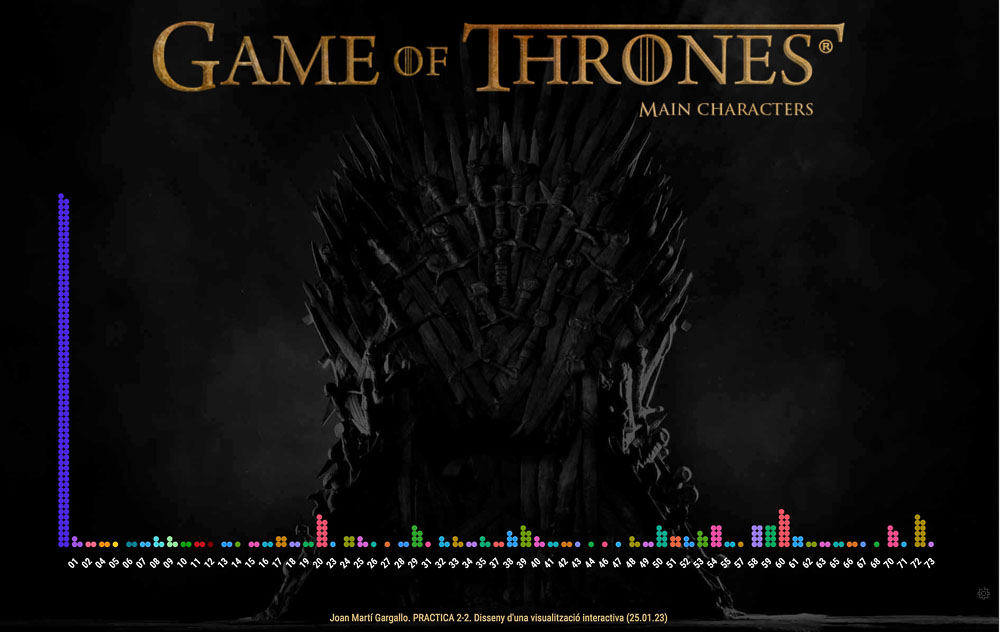
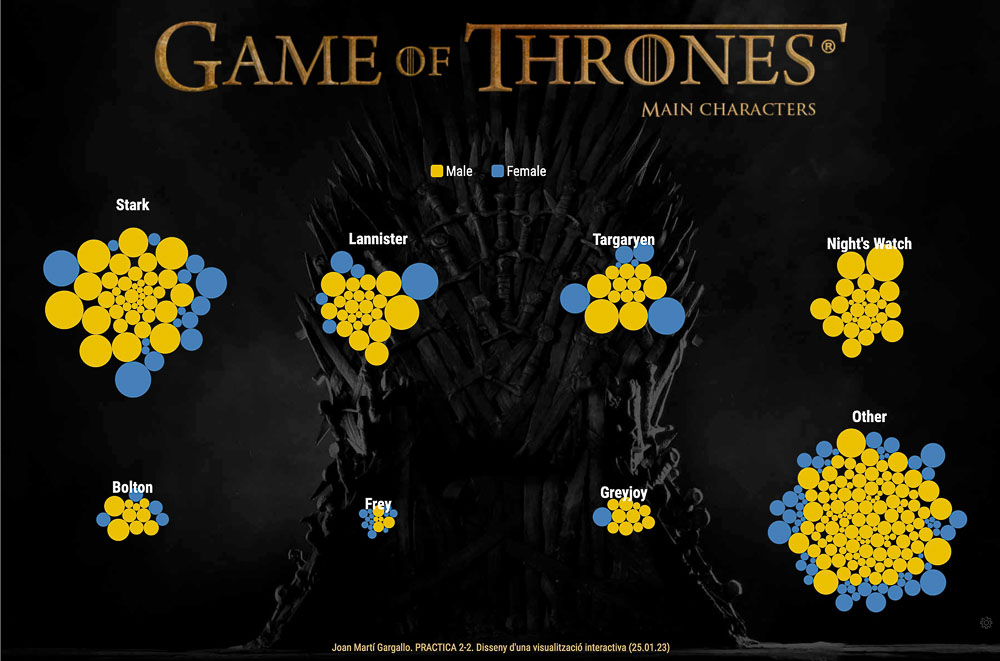
"Game of Thrones, main characters" infographics
January 2023
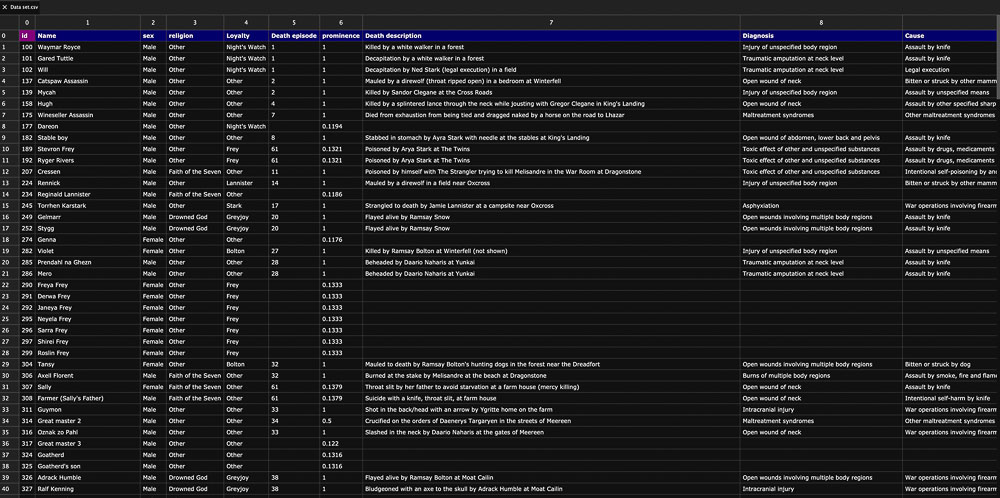
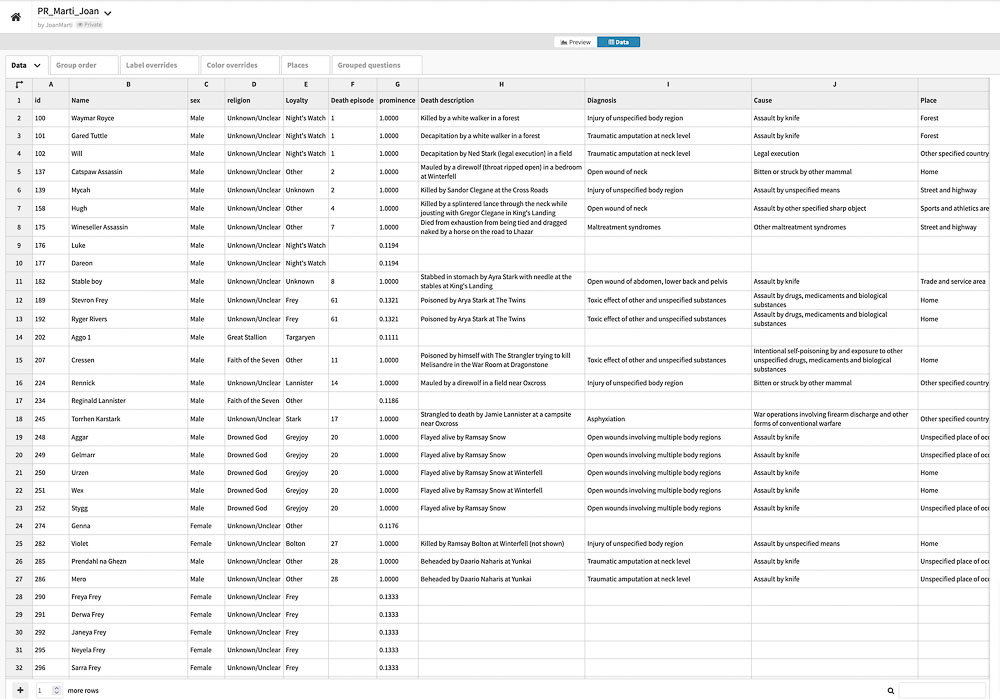
Free-themed academic project, which consisted of designing an interactive data visualization. A graphically contextualized infographic is built starting from the adequacy of the original dataset “Game of Thrones mortality and survival”. It considers the gender perspective, religion, or loyalty of the 332 main characters. A data visualization that allows the user to draw conclusions from comparisons, both in graphic format of circles and in bars.
This activity corresponds to the subject “Infographics and visualization” of the Degree in Design and Digital Media Creation (UOC).
Software: Flourish
Hardware: Mac